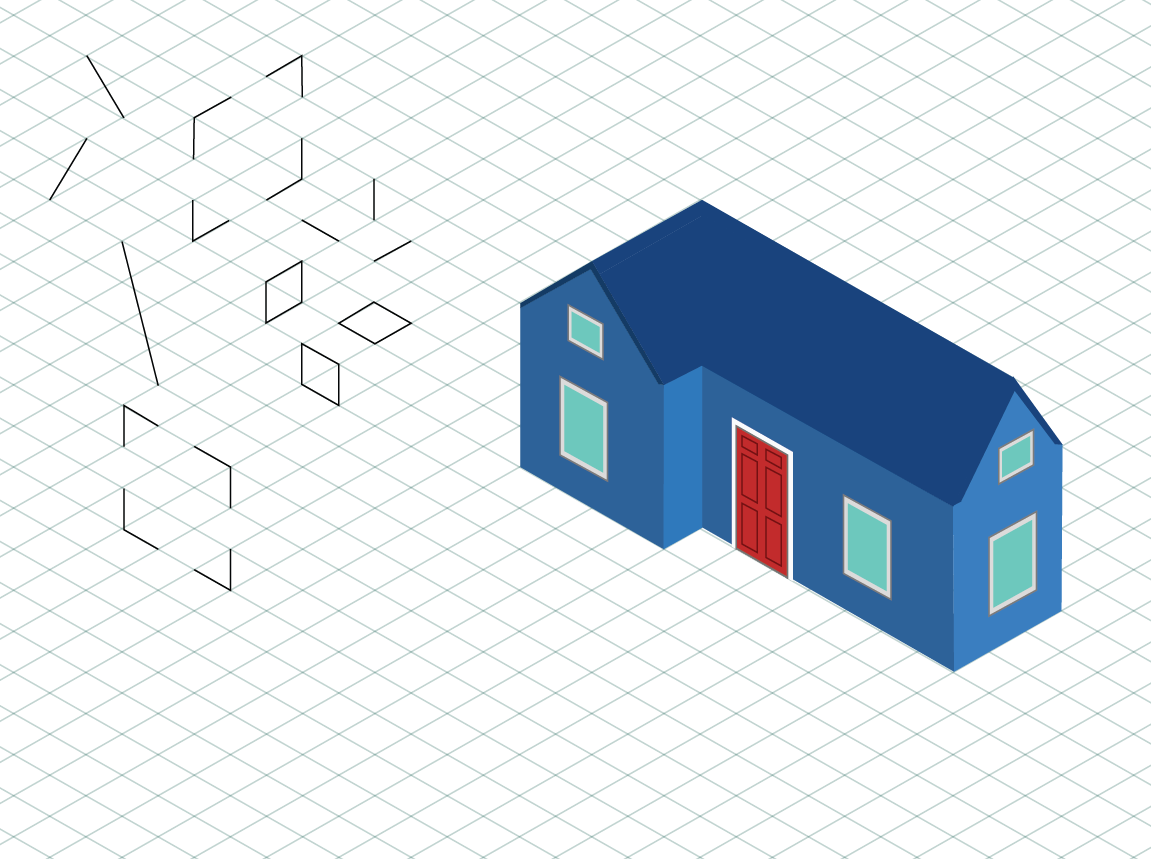
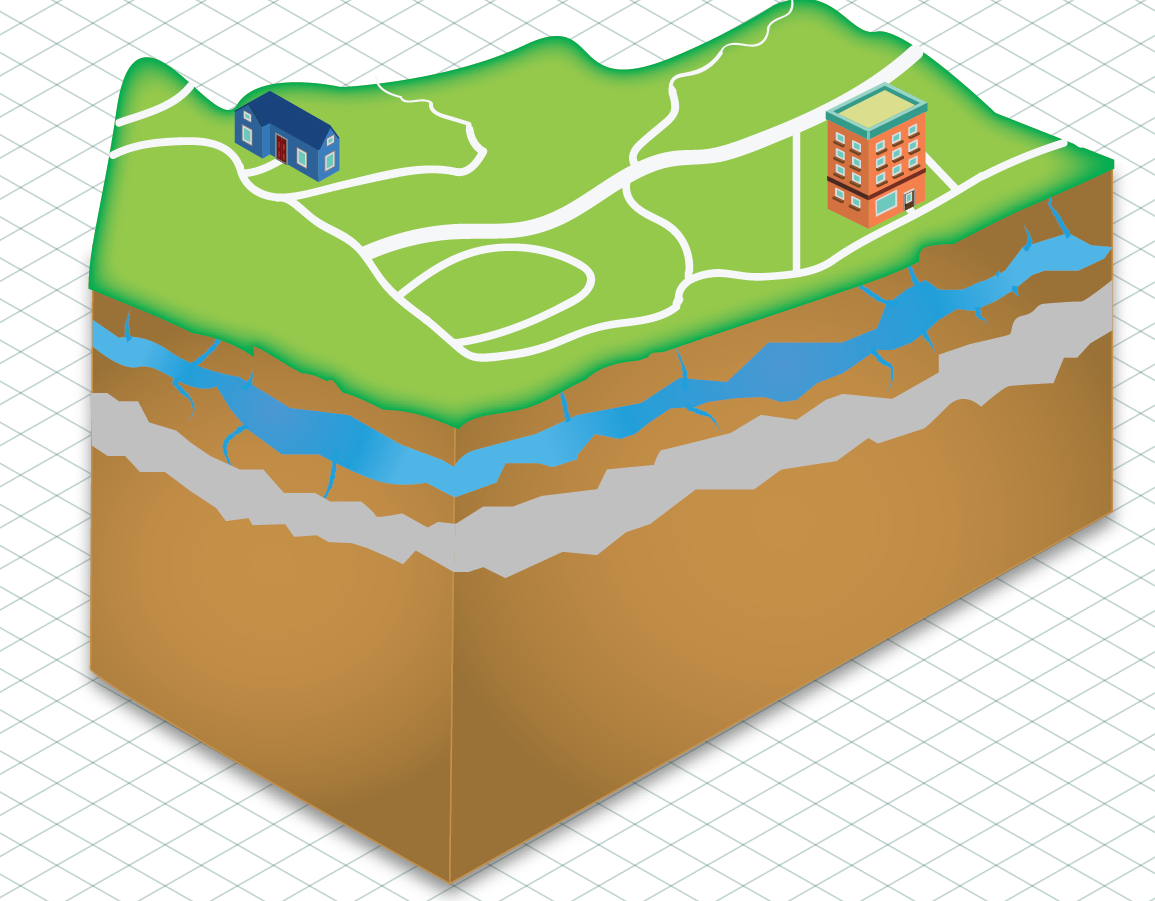
Today I was working from home. I attempted to install ArcGIS a few times but the website is incredibly frustrating and I couldn't get the software for free even when I registered as K-12 education. I will try again another day. I also continued to work on my Infographic. I completed a house to add to the landscape and am going to start making a natural gas well (above). I am in the final 1/2 of the project I'd say. I added veins of rock and a layer of water to the diagram (below).
You have definitely got the visual design chops, Ryan. Now what will really make the most useful learning experience for you during this internship will be the integration of your design skills with a real world data source. The goal is to "visualize data", so you want to start with the data and then let the visualization follow from the story you want the data to tell to your viewers.
ReplyDeleteMr. Elkner, I understand what I am doing with this project. I am going to finish the base of the diagram before I work on the data so I have something to put it on. It may not look satisfactory right now but a big part of computer graphics is building layer upon layer. It may be hard for you to see right now the final product because of this layer upon layer method. I already have a plan but I appreciate your response.
DeleteAfter seeing the final product of this graphic, it is great to see the various layers you had to develop. However, what you will learn as you do more in technology and design is that your work will become more relevant and useful if you start with the data. I think you were more interested in learning how to create different graphics using Adobe Illustrator for a topic like energy and minerals. I discovered in this process that you are a natural designer. What will make you a better technologist and designer is when you apply these design skills to an actual design problem.
ReplyDeleteI hope you write another blog post that shows the final product and how we can use the graphic at USGS.