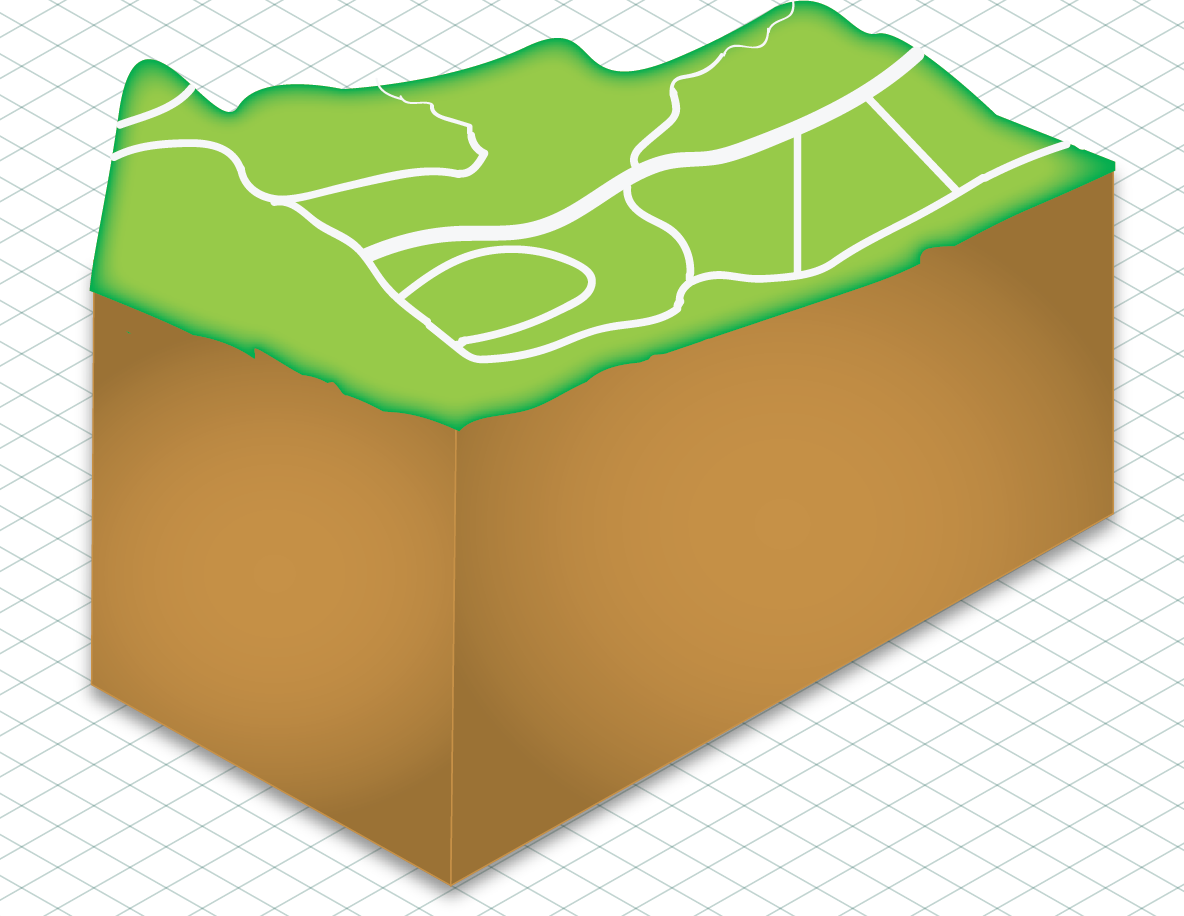
Today I continued with Adobe Illustrator. I finished the road work on my infographic, Aligned the ground so it was isometric (bottom), and began working on buildings to populate the surface (top). Next time I have an opportunity I will color the building so it fits with the cartoony color scheme and begin working on other buildings. Then I will begin populating the underground area with caves and minerals with arrows point to the materials explaining USGS statistics about them. Today we also saw a Webinar about CartoDB which was interesting, the most interesting part to me was the usage of CartoDB in national parks for live updating app features.

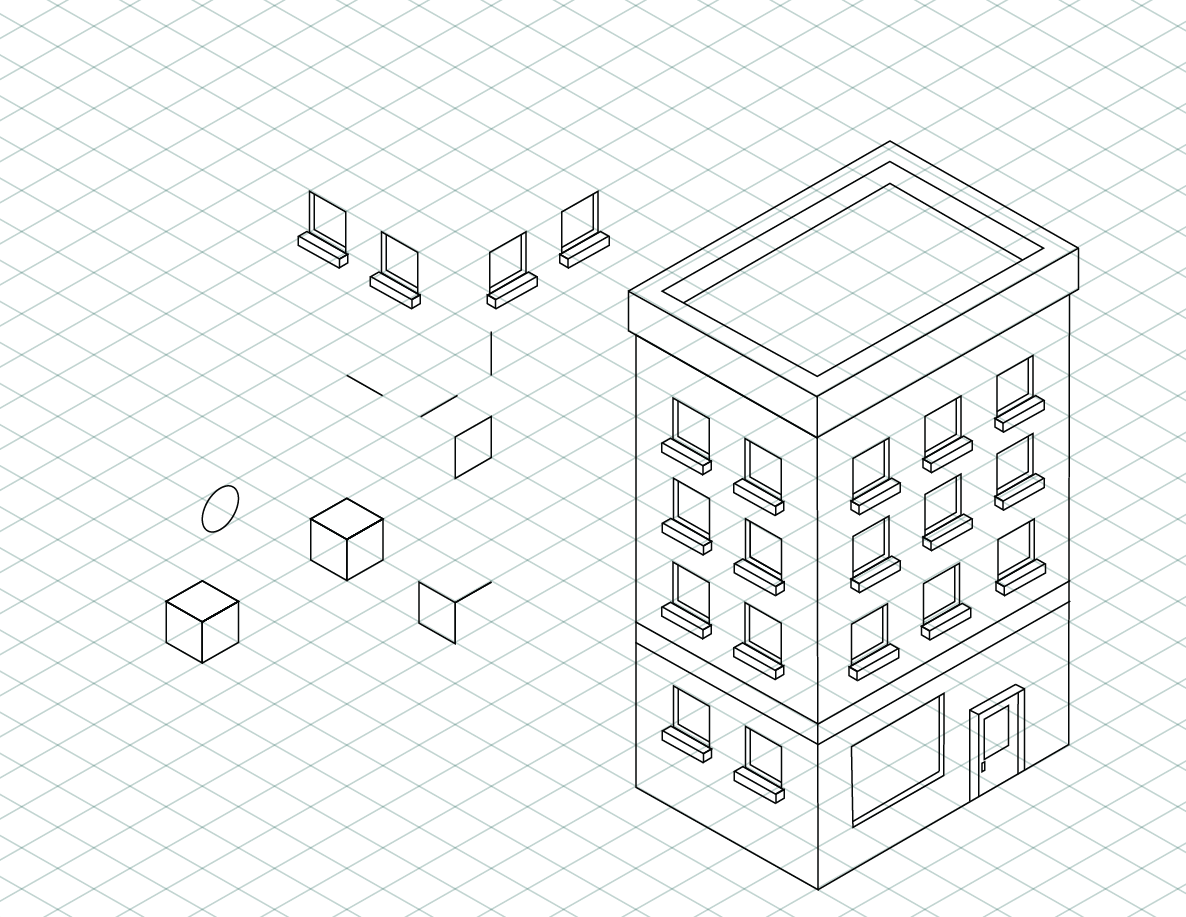
Nice illustration! In a single image it gives me an idea of the process you use to create the building.
ReplyDeleteThis is a great set of graphics you made with Adobe Illustrator. I'm glad you are well adept to using this tool. It would be great to see what progress you have made since last week. It is helpful to know what you are thinking of doing and you started to explain it in this post. It would be even better if you could refer to the USGS Minerals dataset that you plan to use for your infographic. It might help give you an idea of what kind of graphics you should be developing. Remember to let the data guide you in how you design these graphics. Make an effort to explain your thought process of how and why you are making these graphics. Blogging every day during your internship is important and a requirement to allow your mentors and peers better understand the work you are doing and what progress you have made.
ReplyDelete