Tuesday, July 21, 2015
Day ?? - 7/21/15
Today I worked on using Tableau. I took a data set from the USGS website and created a map below, I am working on transferring more data from one spreadsheet and adding it to this. This map currently shows different locations that rare earth elements can be found around the earth. I embedded it into the blog so you can interact with it. I dropped work on my info graphic but I'm still happy with how it looks. Tomorrow for the final day I will work on finalizing my work to an extent that I can present it.
Monday, July 13, 2015
Day ?? - 7/13/15
Thursday, July 9, 2015
Day 8 - 7/9/15
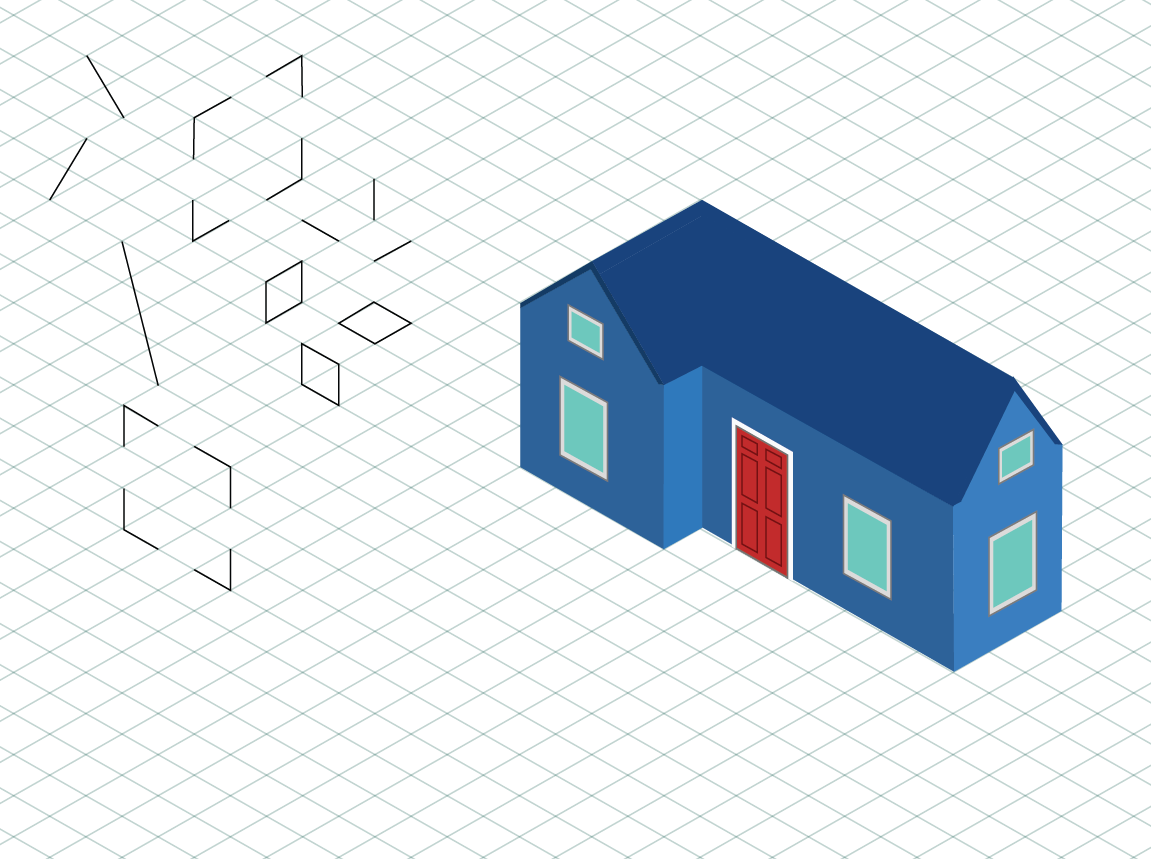
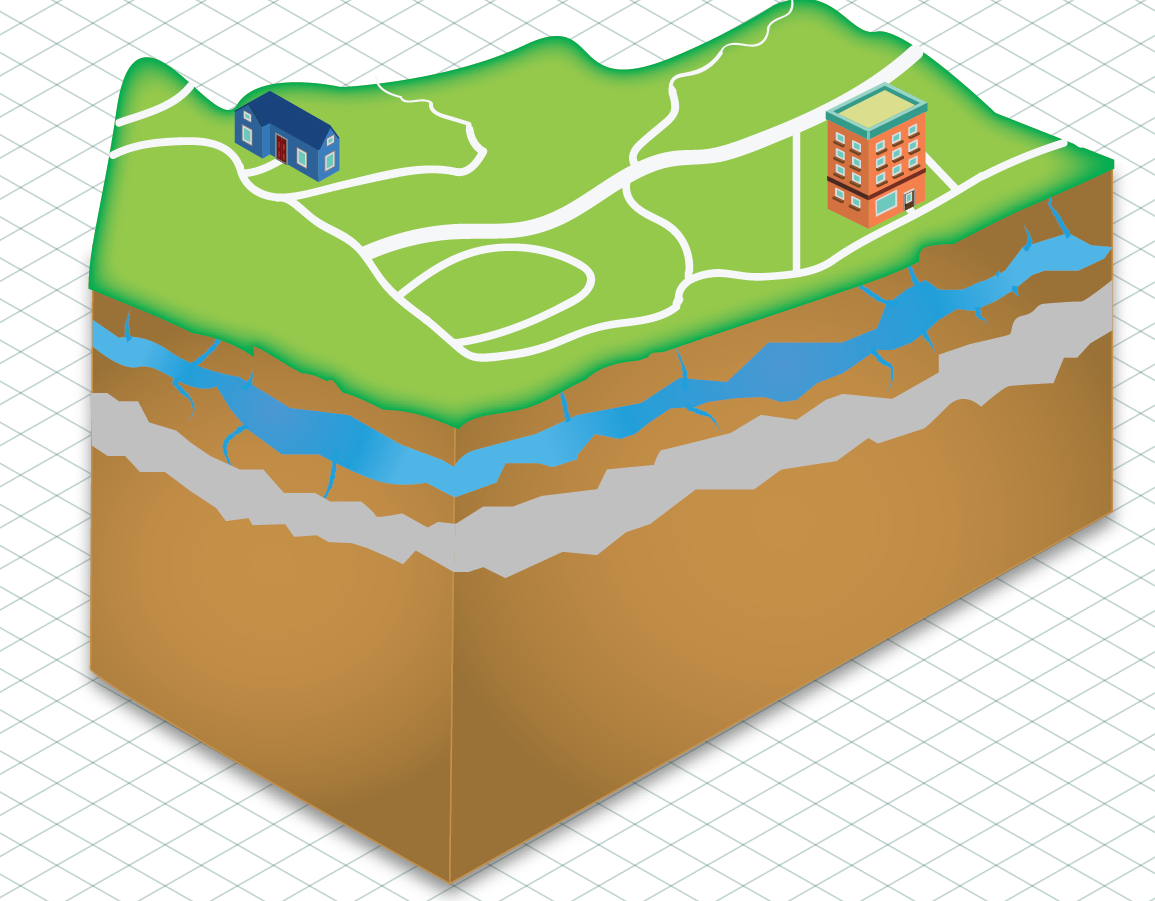
Today I was working from home. I attempted to install ArcGIS a few times but the website is incredibly frustrating and I couldn't get the software for free even when I registered as K-12 education. I will try again another day. I also continued to work on my Infographic. I completed a house to add to the landscape and am going to start making a natural gas well (above). I am in the final 1/2 of the project I'd say. I added veins of rock and a layer of water to the diagram (below).


Tuesday, July 7, 2015
First Field Trip
On Thursday we took our first field trip to USGS to see both the building and the function of the people who work there. We saw a presentation on various rocks and minerals like coal, copper, and the dwindling supply of helium. It was interesting to me to see how much we need helium and just how little we had left. This is a problem and will become more of a problem in the future and the USGS are trying to look for new supplies of helium to satisfy the growing need for it. We ate lunch at a very nice food court. We then went to see a presentation by another group the Eastern Research Center at the USGS who do research around the east coast. They were a lot more technology oriented then the rest of USGS so it was interesting to learn about the different methods that they use in their work environment and the process by which they go about a project.
Wednesday, July 1, 2015
Day 3 - 7/1/15
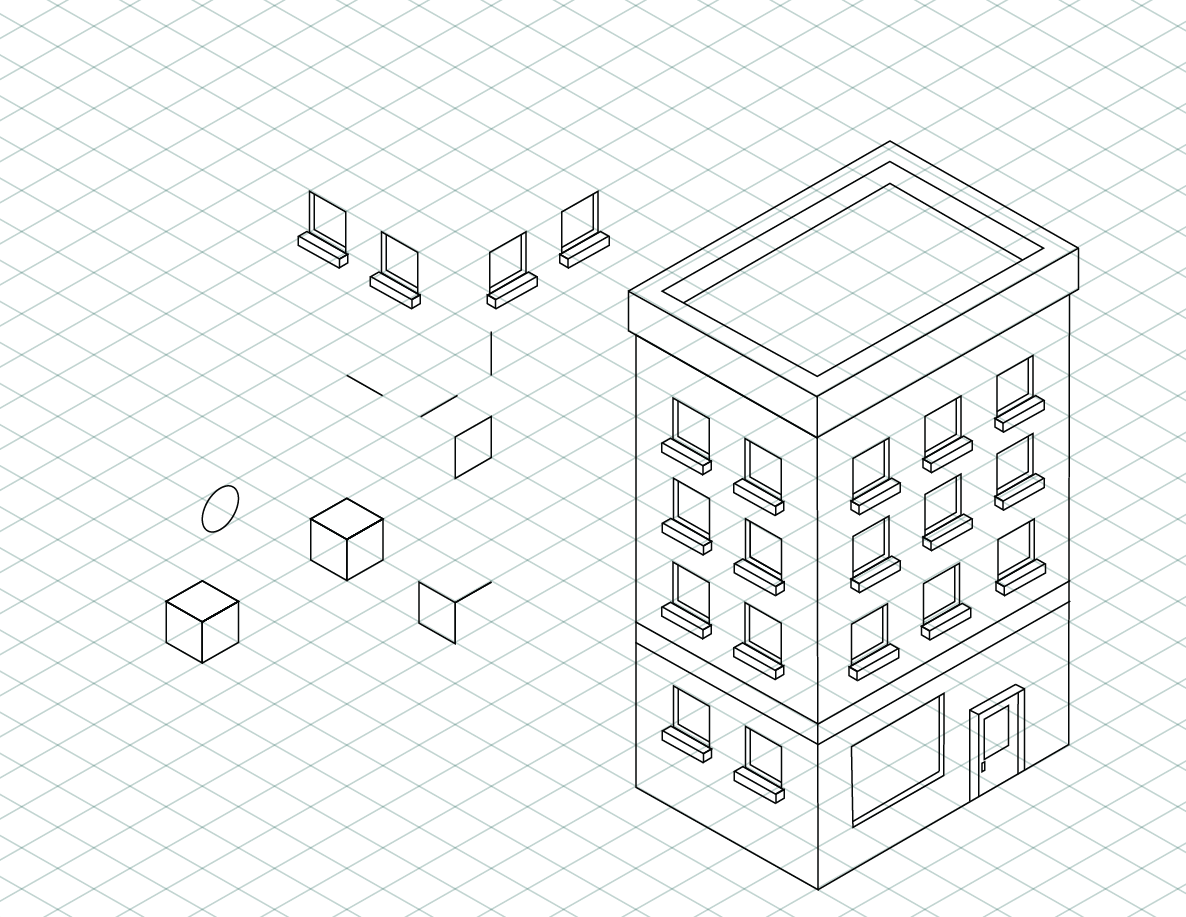
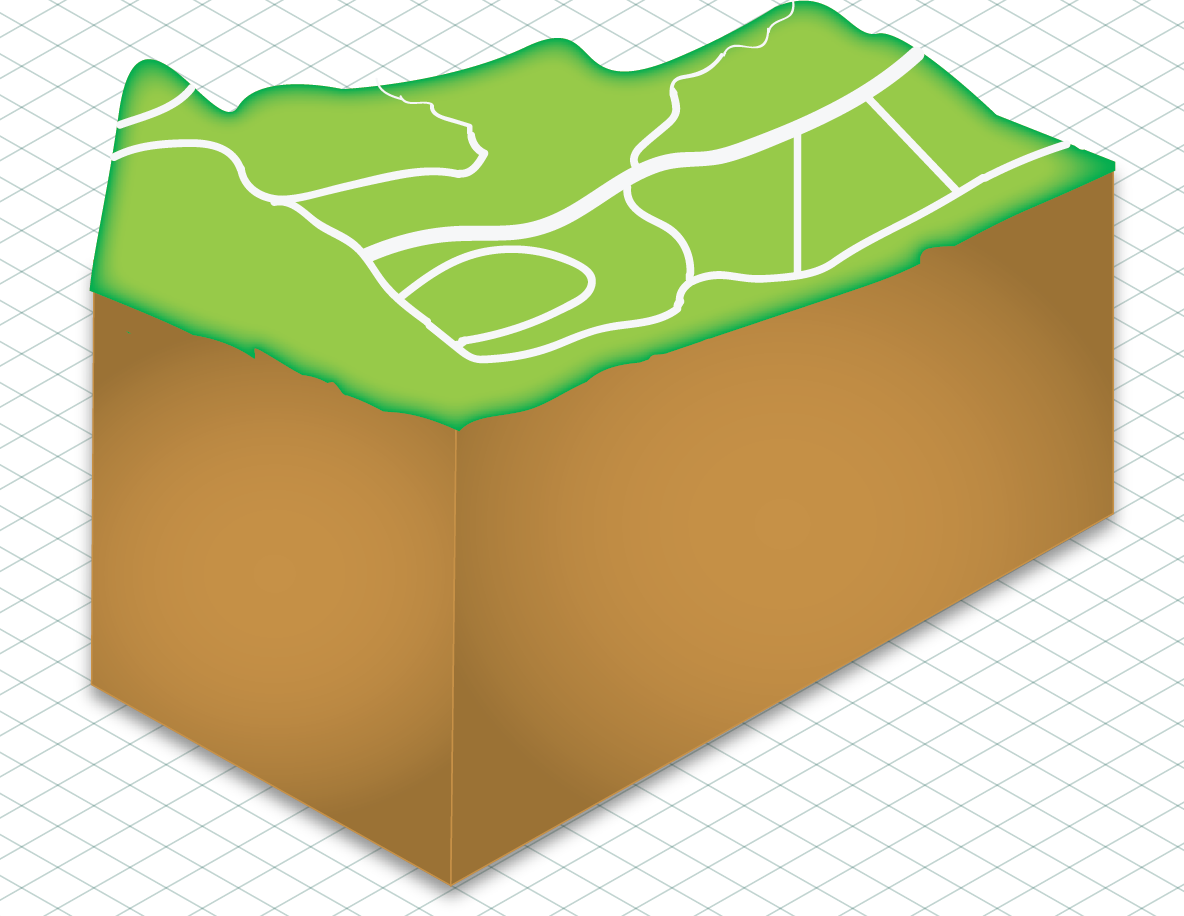
Today I continued with Adobe Illustrator. I finished the road work on my infographic, Aligned the ground so it was isometric (bottom), and began working on buildings to populate the surface (top). Next time I have an opportunity I will color the building so it fits with the cartoony color scheme and begin working on other buildings. Then I will begin populating the underground area with caves and minerals with arrows point to the materials explaining USGS statistics about them. Today we also saw a Webinar about CartoDB which was interesting, the most interesting part to me was the usage of CartoDB in national parks for live updating app features.


Monday, June 29, 2015
Day 1 - 6/29/15
Today was the first day of the internship. We looked at many different methods of displaying data some static images, other interactive activities. We worked on critiquing existing info graphics and developing solutions for the problems in order to prevent future mistakes and help with development of our own graphics. I began looking at many different graphs and data displays as well as the raw data provided by the USGS and began brainstorming ideas to better display the data. I went in to Adobe Illustrator and worked on simple info graphic elements that I could use to display the data and began trying to fit the data in to the graphics to finish off the day.
Subscribe to:
Comments (Atom)